$HIMZ: Technical Analysis and the Case for 10x Upside Potential as a 2x Leveraged Play on $HIMS
Published: January 16, 2026 • Market Analysis
Tags: hims, himz
$HIMZ: Technical Analysis and the Case for 10x Upside Potential as a 2x Leveraged Play on $HIMS
The Defiance Daily Target 2X Long HIMS ETF (HIMZ) offers leveraged exposure to Hims & Hers Health, Inc. ($HIMS), a leading telehealth platform specializing in personalized treatments for hair loss, sexual health, weight management, and mental health. Launched to provide 200% daily performance of $HIMS (before fees and expenses), $HIMZ amplifies moves in the underlying stock, making it a high-beta vehicle for traders seeking outsized returns in a bullish scenario.
As of mid-January 2026, $HIMZ trades around $5.30, reflecting significant drawdowns amid pressure on $HIMS shares. However, with strong fundamentals in the underlying business and potential technical setups, some market participants see asymmetric upside—potentially 10x or more—if $HIMS resumes its growth trajectory.


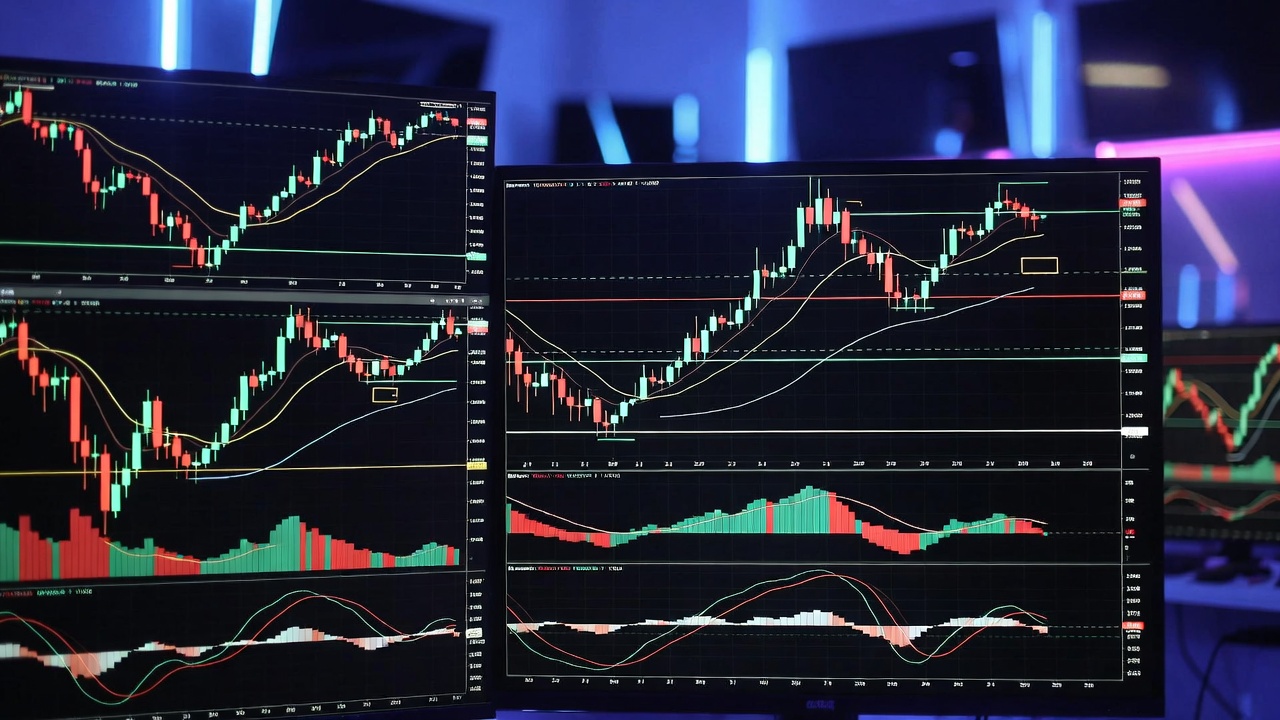
Recent price action in $HIMS (NYSE) showing key levels and indicators on TradingView.
Fundamentals Supporting the Thesis
$HIMS continues to execute on a large addressable market in consumer health and wellness. The company has expanded beyond initial offerings into high-growth areas like GLP-1 compounded medications for weight loss, driving subscriber growth and revenue expansion.
Analysts project continued momentum into 2026-2030, with long-term targets implying substantial upside if execution remains strong. Recent pullbacks appear driven by sector rotation and concerns over GLP-1 competition, but core metrics (subscriber adds, retention, margin expansion) remain intact.
For $HIMZ, this translates to leveraged participation: a sustained 50% rally in $HIMS could theoretically produce far greater percentage gains in the ETF (though daily resets and volatility decay temper long-term holds).
Technical Analysis: $HIMS
$HIMS has experienced a sharp correction from 2025 highs, trading in a downtrend channel with lower highs and lows. Key observations:
Moving Averages: The stock sits below its 50-day and 200-day SMAs, signaling bearish momentum. A golden cross (50-day crossing above 200-day) would be a strong bullish signal.
RSI (14): Currently near oversold territory (<30 in recent months), suggesting potential exhaustion of selling pressure.
MACD: Bearish crossover persists, but histogram narrowing could prelude divergence.
Support/Resistance: Major support near current levels (~$20-25 zone, depending on exact pricing); resistance at prior highs (~$40-50).
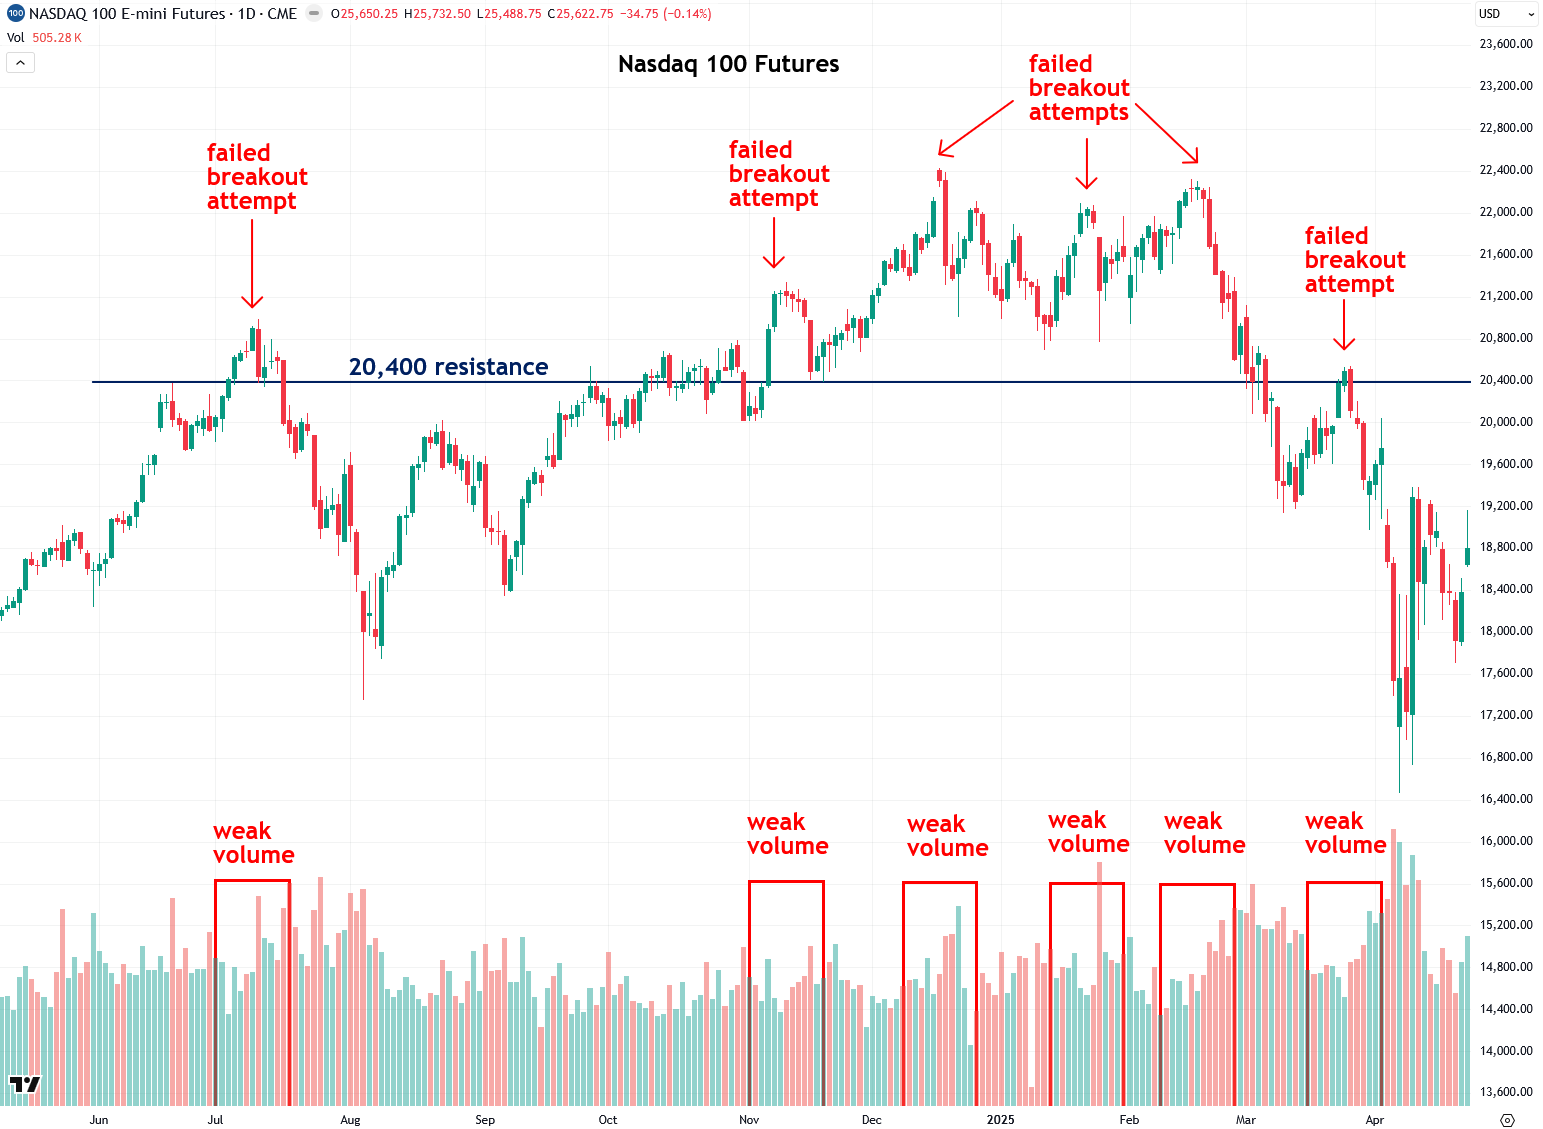
Volume: Declining volume on down moves indicates weakening conviction among sellers.
A breakout above the 200-day MA with expanding volume would confirm reversal.
:max_bytes(150000):strip_icc()/dotdash_Final_How_do_the_MACD_and_RSI_indicators_differ_Nov_2020-02-74d48a786c274cd5b18a2eb1ab6f48fe.jpg)

Illustrative technical indicators: MACD and RSI setups commonly used in momentum analysis.
Technical Analysis: $HIMZ
As a 2x daily leveraged ETF, $HIMZ exhibits amplified volatility and has declined over 70% from inception highs due to the underlying correction and compounding effects.
Price Action: Trading near all-time lows (~$5), with potential capitulation characteristics.
Moving Averages: Deep below all major EMAs/SMAs; extreme deviation often precedes mean reversion in leveraged products during sector recoveries.
RSI: Deeply oversold, with potential for bullish divergence if $HIMS stabilizes.
Volume Profile: High-volume nodes at lower prices suggest accumulation zones.
Chart Patterns: Possible double-bottom or falling wedge formation; a confirmed breakout with volume surge could target prior resistance levels rapidly.
In trending markets, leveraged ETFs like $HIMZ can deliver explosive moves—especially on positive catalysts (earnings beats, product launches, short squeezes).
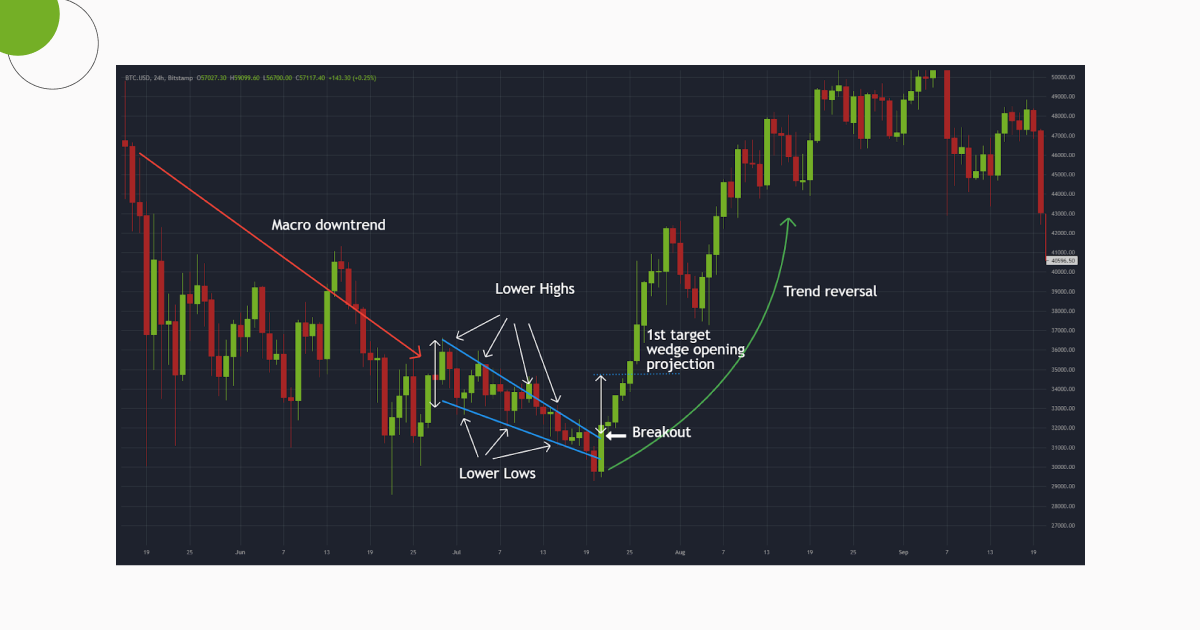
Examples of bullish breakout patterns confirmed by volume—relevant for leveraged vehicles in recovery phases.
The 10x Potential Scenario
From current levels (~$5.30), a 10x move implies ~$53.
This is achievable if:
$HIMS rallies 100-200% over 12-24 months (aligned with some long-term analyst targets toward $40-60+).
Uptrend minimizes daily reset decay.
Catalysts: Strong earnings, GLP-1 tailwinds, margin expansion, or broader healthcare rotation.
Historical precedents in single-stock leveraged ETFs (during underlying recoveries) show multi-bagger potential from depressed bases.
Risks and Considerations
Leveraged ETFs are designed for short-term trading. Long-term holds suffer from:
Volatility Decay → Even if $HIMS ends flat over a period, $HIMZ can lose value.
Downside Amplification → 2x losses on declines.
High expense ratios and tracking errors.
This is a high-risk, high-conviction play—not suitable for all investors.
Conclusion
$HIMZ offers leveraged exposure to a compelling growth story in $HIMS at currently depressed valuations. Technical indicators show oversold conditions with reversal potential, while fundamentals support multi-year upside.
A sustained $HIMS rally could drive significant outperformance in $HIMZ, with 10x not impossible in an optimal scenario. Traders should monitor key levels closely, use strict risk management, and consider position sizing carefully.
Always conduct your own research and consult professional advice. Markets involve risk, and past performance is no guarantee of future results.